|

|
The Poorest States are NOT Run by Republicans
Posted by:
Jennifer
()
Date: July 26, 2018 11:42PM Correcting another Lib meme, Lib rhetoric, Lib narrative - that most of the 10 poorest states in the US are run by Republicans ...
********* NO, 9 OF THE 10 POOREST STATES ARE NOT REPUBLICAN Propaganda: The 10 Poorest States in America are run by Republicans! This proves their policies don’t work! (please see the article itself because it has links to the sources of the information contained in the article) [justbunk.net] First of all, this is where and when the Lib Fib started - [caffertyfile.blogs.cnn.com] And then from Occupy Democrats - [www.facebook.com] ********** FACTS: This propaganda started in September of 2011 (ahead of an election cycle) by Jack Cafferty of CNN. Cafferty’s claim has been thoroughly debunked. It raised its head, again, in 2014 (ahead of an election cycle) when posted by Occupy Democrats on Facebook and, not surprisingly, was rated as “True” by left-leaning Politifact. The meme goes like this: 9 out of the 10 poorest states are Republican. Therefore, Republican policies don’t work. Where does “policy” come from? It comes from government; Governors and Legislatures. So let’s take a look at the 10 poorest states and their current governments: Mississippi: (R) Governor, (R) Senate, (R) House of Representatives West Virginia: (D) Governor, (D) Senate, (D) House of Delegates Arkansas: (D) Governor, (R) Senate, (R) House of Representatives Kentucky: (D) Governor, (R) Senate, (D) House of Representatives Alabama: (R) Governor, (R) Senate, (R) House of Representatives Tennessee: (R) Governor, (R) Senate, (R) House of Representatives Louisiana: (R) Governor, (R) Senate, (R) House of Representatives New Mexico: (R) Governor, (D) Senate, (D) House of Representatives South Carolina: (R) Governor, (R) Senate, (R) House of Representatives Oklahoma: (R) Governor, (R) Senate, (R) House of Representatives Of these top ten, Democrats currently control 3 Governorships, and 5 legislative bodies. Government is shared between Democrats and Republicans in 3 out of the 10 and the second poorest state is completely controlled by Democrats. So, how do progressives claim 9 of the 10 poorest states are Republican? By redefining what a “Republican State” is. At the top of the Politifact article, they write: “We’ll start with the standard definition of a Red State: one that voted for the Republican Candidate in the most recent presidential election.” Whoa, wait a minute. The meme doesn’t say “Red States” it says “Republican”. And it’s used to claim Republican Policy doesn’t work. What does voting for a GOP president in the last election have to do with the economic effects of state government policies? This is a typical Progressive deception: if the reality of a thing is inconvenient, simply change the definition of that thing (see Global Warming to Climate Change). It’s also important to know that, until recently, the South was controlled by Democrats for a very long time (from Reconstruction until the early 2000s). Republicans didn’t hold majorities in the South until after the 2010 elections. So if we’re indicting policies, here, shouldn’t we be looking at centuries of Democrat rule, not just years of Republican rule? And why did the South switch from Democrat to Republican if Democrat policies were working so well? And this is largely nonsense anyway, as the roots of Southern Poverty stem from the Civil War and Reconstruction, not policies enacted over the last few years. And then there’s this: Blue States (states that voted for Obama in 2008) have done much worse economically than Red States. Job Growth: Blue 1.2%, Red 1.9% Unemployment: Blue 8.5%, Red 7.4% Income: 4.27%, Red 4.35% Home Prices: Blue -18.5%, Red -7.5% Gas prices: Blue states 5% higher than Red States The only economic indicator that was better in Blue States than Red States was GDP growth (2.5% vs 2.2%). Unless you’re a politician, jobs, income, home values, and gas prices probably mean more to you than GDP. You can ignore the roots of Southern Poverty, you can ignore that these poor states were controlled by Democrats for nearly two centuries, and you can ignore that recent economic trends are much better in Red States than Blue States, but you can’t ignore that 9 out of the 10 poorest states are not governed by Republicans. And, so, this meme is just bunk. Re: The Poorest States are NOT Run by Republicans
Posted by:
Jennifer
()
Date: July 27, 2018 01:48AM This is where Forbes Debunked the Lib Lie -
Are the 10 Poorest U.S. States Really Republican? Jun 7, 2012 [www.forbes.com] “Most of the 10 poorest states are Republican” is a quote of CNN’s Jack Cafferty. It appeared in his “Cafferty File” blog last September 22, and was accompanied by the opinion, this is “something the GOP can’t be too comfortable with.” Indeed, in an election year, you can bet that Democrats will try to make hay with those data. My previous column made the case that Democratic Party policies have induced the impoverishment of America’s poorest cities. Turnabout is fair play. If Republican policies have led to the economic stagnation of entire states, whereas Democrats are only responsible for ruining cities, then the Dems might have the stronger campaign talking point. Let’s examine the 10 poorest states to see if Republicans are to blame for their relative economic standing. The poorest states, based on per capita income, are, from first to last: Mississippi, Arkansas, Tennessee, West Virginia, Louisiana, Montana, South Carolina, Kentucky, Alabama, and North Carolina. Of these, exactly half—Arkansas, Kentucky, Montana, North Carolina, and West Virginia—have Democratic governors and three have Democratic majorities in the lower house of their legislature, so these state governments can hardly be classified as completely Republican. On the other hand, only North Carolina voted for Obama in 2008, so in that sense, these states may be leaning Republican. A common analytical error is the “post hoc ergo propter hoc” fallacy—“after this, therefore because of this.” For example, chronic federal deficits became chronic in the 1960s. What changed in America at that time? Alaska and Hawaii were added to the union in 1959 and 1960, respectively; therefore, the erroneous assertion to follow is that we need only expel those two states from the Union to solve our deficit spending problem. Absurd, right? Similarly, we can’t facilely assume that the lower per capita incomes in the 10 poorest states were caused by Republican policies. Looking at the list of the 10 poorest states, all except Montana are east of (or border on) the Mississippi River. That means they are older states. Those nine also happen to be concentrated in the South. This is significant: They were all slaveholding states. They focused on producing commodities, whereas the northern states produced more value-added goods, more manufactured goods, more capital-intensive goods. Combined with national policies that conferred economic advantages on the relatively industrialized, higher capitalized North—policies that created some of the friction that led to the Civil War—the South’s economic development lagged. As is common in societies based on producing raw commodities, the Old South had an elite that owned the land and employed a poorly educated workforce to plant, tend, and harvest the crops. Historically, then, education was of less importance, and therefore emphasized less, in the South than in the North—a trend that contributed ongoing economic advantages to the North. After the Civil War, Republican carpetbaggers from the North kicked around the defeated South, further widening the economic gap between the two regions. One political consequence was that the Deep South was monolithically Democratic for the next century. Only in the last generation, when the secular counterculture took over the Democratic Party, did many Southerners finally bury the distant past and register as Republicans. In short, those nine erstwhile slaveholding states have been lagging behind the northern states economically for two centuries. Just because one generation of leaning Republican has not eliminated a disparity that was entrenched for centuries, it is not an indictment of Republicans. As for Montana, whose people elect Democrats and Republicans to statewide office with almost equal frequency, its economic status has a geographical cause. Montana is remote and its climate is harsh; consequently, it has never attracted enough people to achieve an economic “critical mass” to advance much beyond the commodity-related businesses of farming, ranching, and mining. That is why it has lagged economically—not because of anything Republicans have done. Another common mistake in economic analysis, seen often, for example, in the (irrational) rationale that liberals use when resisting cuts in marginal tax rates, is to adopt a static rather than dynamic view—to see life and economic conditions in terms of snapshots rather than as a motion picture. In the politically motivated attempt to blame Republicans for the lower incomes in the 10 poorest states, CNN’s Cafferty and Democrats have taken one snapshot—of the census’ income statistics—and combined it with another snapshot—of current political leanings—to create the impression that Republican policies make America poorer. The more important factor is not the economic ranking of states at a point in time, but the overall trends. An important article by John Merline compared the economic performance of blue states and red states during the presidency of Barack Obama. The trend of economic indicators clearly favors Republican states. Democratic states have experienced lower growth in both jobs and income in the last few years. Home prices have fallen further in blue states, and their unemployment rates are higher. In other words, a dynamic economic analysis of the states casts a far more favorable light on Republican states than static analysis. Since real life is dynamic, not static, Republicans can make the stronger case about which party is best suited to lead the way to greater prosperity. The most fundamental difference between the data that conservatives prefer—that the 10 poorest cities are longtime Democratic strongholds—and the data that liberals will be more inclined to cite—that the 10 poorest states are predominantly Republican, is that conservatives can point to actual policies that Democrats implemented that contributed to the impoverishment of the cities, while the liberals cannot point to specific GOP policies that have caused the poorer states to lag behind. The Democratic case is illusory and circumstantial; the Republican case is solid and substantial. However, in a country where so many people are economically and historically illiterate, combined with the human proclivity whereby “a man hears what he wants to hear and disregards the rest” (Paul Simon, “The Boxer”), the Democrats may be able to score some points with a hollow argument. The Republicans, though, have the facts on their side. Re: The Poorest States are NOT Run by Republicans
Posted by:
Jennifer
()
Date: July 27, 2018 01:55AM Also, more explanation/info on how Dem policies destroys cities and states -
President Obama's Wealth Destroying Goal: Taking The 'Curley Effect' Nationwide [www.forbes.com] It’s hard to think of anything more perverse in American politics than the Curley effect. The Curley effect historically has been an urban phenomenon, but President Obama seems bent on taking the entire country down this wretched path. As defined by Harvard scholars Edward L. Glaeser and Andrei Shleifer in a famous 2002 article, the Curley effect (named after its prototype, James Michael Curley, a four-time mayor of Boston in the first half of the 20th century) is a political strategy of “increasing the relative size of one’s political base through distortionary, wealth-reducing policies.” Translation: A politician or a political party can achieve long-term dominance by tipping the balance of votes in their direction through the implementation of policies that strangle and stifle economic growth. Counterintuitively, making a city poorer leads to political success for the engineers of that impoverishment. Here’s an example of how the Curley effect works: Let’s say a mayor advocates and adopts policies that redistribute wealth from the prosperous to the not-so-prosperous by bestowing generous tax-financed favors on unions, the public sector in general, and select corporations. These beneficiaries become economically dependent on their political patrons, so they give them their undivided electoral support—e.g., votes, campaign contributions, and get-out-the-vote drives. Meanwhile, the anti-rich rhetoric of these clever demagogues, combined with higher taxes to fund the political favors, triggers a flight of tax refugees from the cities to the suburbs. This reduces the number of political opponents on the city’s voter registration rolls, thereby consolidating an electoral majority for the anti-wealth party. It also shrinks the tax base of the city, even as the city’s budget swells. The inevitable bankruptcy that results from expanding expenditures while diminishing revenues can be postponed for decades with the help of state and federal subsidies (“stimulus” in the Obama vernacular) and creative financing, but eventually you end up with cities like Detroit—called by Glaeser and Shleifer “the first major Third World city in the United States.” The Curley effect is extensive. Perhaps you have seen the chain e-mail listing the ten poorest U.S. cities with a population of at least 250,000: Detroit, Buffalo, Cincinnati, Cleveland, Miami, St. Louis, El Paso, Milwaukee, Philadelphia, and Newark. Besides all having poverty rates between 24 percent and 32 percent, these cities share a common political factor: Only two have had a Republican mayor since 1961, and those two (Cincinnati and Cleveland) haven’t had one since the 1980s. Democratic mayors have had a lock on City Hall despite these once-great and prosperous cities stagnating on their watch. This is the Curley effect in action. Let me comment on the city on that list that I know the best—Detroit. (I grew up a few miles from its city limits.) In the 1920s, Detroit was arguably the richest city in the world. Today it is broke—a shadow of its former self after 51 years of Democratic hegemony and a Curley-like agenda. I’m going to say something provocative that leftists will surely quote out of context, but it needs to be said: Detroit was a lot better off in the 1950s, when the city funded one of the best zoos in the country but had not yet built today’s gravy train for favored segments of the human population. Detroit’s decline has paralleled a shift toward funding far fewer zoo animals and far more human beings. Critics may take this to mean that I value animals more than people. On the contrary, it is because I value humans more than animals that I find the policy shift to be morally offensive in addition to being so obviously destructive economically. It is bad enough to see a trapped lion carrying 80 pounds of flab that a lion in the wild would never have, but why would you reduce human beings to a similarly pathetic dependency? The bars that ensnare humans behind the economic and psychological cages of the government dole may not be physical, but it is pathetic to see people reduced to lives of unproductive idleness and despair, all in the name of “compassion” and, of course, for the sake of cementing Democratic mayors in office. What is most troublesome about the Curley effect is that it is spreading beyond its historical setting of cities. Entire states—most notably our most populous, California—are manifesting all the symptoms of the Curley effect: Democrats enjoying electoral hegemony; businesses and middle-class individuals, more Republican than Democratic, emigrating to states with less oppressive tax regimes; reduced job opportunities; a budget careening toward bankruptcy. The ultimate political prize for the Democrats, of course, would be to control the national government. (Note: Yes, I know that technically we have a “federal” government, but if Big Government Democrats find a way to forge a permanent majority, you can kiss the last vestiges of federalism goodbye.) Everything Obama has done has been designed to strengthen Democratic constituencies (e.g., stimulus spending steered predominantly toward unions and strategically allied state and municipal entities; waivers from Obamacare for unions; a hefty 23 percent increase in the Index of Dependence on Government during Obama’s first two years) and to weaken Republican constituencies (e.g., making small business formation more difficult by impeding venture capitalists; refusing to amend Sarbanes-Oxley; using Dodd-Frank regulations to discourage loans; fewer waivers from Obamacare; proposing lower tax rates for large corporations, but not on the “S” corporations that are the preferred choice of small business owners; constant efforts to raise taxes on the “rich”—which means, as we’ve seen in Detroit, California, and other Curley effect victims, higher taxes on the middle class). Obama’s smash-mouth, Curley-like politics is all about choosing winners and losers. Reread his State of the Union address from January, and you see a parade of proposals to take from A to give to B, to encourage businesses to do C and discourage them from doing D. Indeed, Obama seems incapable of suggesting a single economic policy that does not redistribute wealth from his political opponents to his political allies. The message is clear: He wants Americans to be dependent on the government; consequently, he is hostile to the private sector, because a vibrant private sector enhances economic independence and self-reliance. If Obama and his fellow progressives succeed in applying the Curley strategy on the national level, Americans will no longer be able to move to a new city or state to escape the withering economic impact of Curley-effect policies; their only option would be to leave the country. However, it appears that Obama has anticipated that response. To close the escape hatch from an Obama-Curley America, the president signed the Foreign Account Tax Compliance Act that mandates closer monitoring of Americans’ offshore accounts. apparently approves of policies to impose financial penalties on anyone desiring to give up U.S. citizenship, and periodically calls for “global minimum taxes.” The Curley effect already has inflicted great economic damage on important American cities and states. It now presents an existential threat to our entire country. That one of our major political parties has based its own success on such a ruthlessly cynical strategy is disgusting, if not diabolical. How we get off this suicidal path is one of the most urgent challenges facing us today. Re: The Poorest States are NOT Run by Republicans
Posted by:
Jennifer
()
Date: July 27, 2018 02:01AM More Inconvenient Truth from Investors.com about the fact that Blue States are becoming poorer with Dem policies -
Economy: Blue States Worse Than Red Under Obama 5/08/2012 Barack Obama entered the national spotlight with a rousing 2004 Democratic convention speech that talked about how it was wrong "to slice and dice our country into red states and blue states." Last week he reiterated the point in a tweet to his Twitter followers, saying that "there are no red states or blue states, just the United States." But when it comes to the economic recovery, there has been a clear difference. It turns out that blue states have done worse economically than have red states under President Obama, according to an IBD analysis of various government economic data. IBD compared average job growth, unemployment, changes in housing prices, per capita income and GDP growth, and gas prices for the 22 states that voted for John McCain in 2008 and the 28 states that voted for Obama . On every indicator but one, blue states have done worse, on average, than red states. In addition, IBD looked at the economic performance of 11 states that Real Clear Politics lists as tossups for the 2012 presidential election. Many of these purple battleground states have fared far worse than the country as a whole during the past three years. Among the findings: Job growth: The average increase for blue states was just 1.2% from June 2009 — the official start of the economic recovery — to March 2012. For red states, it was 1.9%. The national average was 1.8%, according to the Bureau of Labor Statistics. Unemployment: The jobless rate in March was 8.5% in blue states and 7.4% in red states, BLS data show. Income: Blue states also did a bit worse when it came to per cap ita personal pay, rising 4.27% in 2011 compared with 4.35% in red states, according to the Bureau of Economic Analysis data GDP: The one measure where blue states outperformed was in gross domestic product growth, clocking an average 2.5% increase from 2009 to 2010 vs. red states' 2.2%. State GDP figures for 2011 won't come out until June. Home prices: People living in liberal areas suffered the most when it came to housing prices. Over the past year, the housing price index fell 3.5% in blue states. The index edged up by 0.03% in conservative states. Nationwide, it was down 2.4%, according to the Federal Housing Finance Agency's House Price Index. Over the past five years, housing prices in red states fell 7.5%, but by 18.5% in blue states. Gas prices: Blue states also suffer when it comes to gasoline. All but one of the 10 most expensive gas states voted for Obama in 2008. In contrast, all but one of the 10 cheapest gas states voted for McCain, according to gasoline price data from the AAA's fuel gauge report. On average, blue state prices were 5% higher than those in red states. What explains these different economic outcomes? One possibility is that red states tend to be more business-friendly. George Mason University's Mercatus Center recently. "But in swing states, it's a different story. Republicans may be able to make some hay out of economic distress in swing states that Obama carried in 2008, such as Florida and Nevada." Sabato did note that Virginia is doing well "and the Obama White House and campaign should be able to use the good news to their benefit in November." There's also the question of how the faster growth in red states, if it continues, could affect the election. One possibility is that their economic speed could boost the nation's overall mood and wind up helping Obama's re-election chances. Re: The Poorest States are NOT Run by Republicans
Posted by:
Jennifer
()
Date: July 28, 2018 07:31PM This is another good question - Whether or not the poorest Counties are Republican.
The Answer - Depends on how you measure 'poor'. Are the Poorest Counties Republican? [memepoliceman.com] Courtesy of Occupy Democrats, with over 22,000 likes and 21,000 shares. This meme claims that 95% of the poorest counties and 80% of the poorest states are Republican. Are Republican strongholds responsible for the poorest areas? Let’s take a more comprehensive look. Measuring the Poor There are two primary metrics in analyzing wealth, average income per capita and median household income. Each can be useful, but it’s important to distinguish the difference. Per-capita income is an average of all the income divided by population, while median household income gives us the “middle” income in a given area. Many academics and researchers agree (examples here and here) that median income is the best way to measure poverty. Since income per capita can be skewed by a few wealthy people, it can be unreliable, particularly in areas with high inequality. Imagine a poor small town with one multi-millionaire. The average might increase substantially even though almost everyone is poor. With median income, a few millionaires (or poor “leeches”) won’t skew the results. This distinction becomes apparent as we examine the data of the poorest counties. In fact, the poorest county per capita (Wheeler County, GA) doesn’t even make the lowest 100 counties in median household income! This is how dramatic the difference can be between metrics, it’s not just semantics. As we’ll see, it’s the difference between the poorest counties being primarily Republican, or mostly Democrat. Defining Republican and Democrat For simplicity, we’ll classify each county and state based on their voting statistics in the 2016 presidential election. However, in certain cases, the 2016 election was an outlier, and the county voted previously and consistently the other direction. Thus, it would be unfair to label them Republican or Democrat when they’ve historically voted differently. Those will be noted in the data. List of 20 Poorest Counties by Median Household Income Buffalo, SD: Pop. 1,912 (Democrat) Holmes, MI: Pop. 19,198 (Democrat) Owsley, KY: Pop. 4,755 (Republican) Wilcox, AL: Pop. 11,670 (Democrat) McCreary, KY: Pop. 18,306 (Republican) McDowell, WV: Pop. 22,113 (Mixed, voted R last 2 elections, D previous 9) Bell, KY: Pop. 28,691 (Republican) Clay, KY: Pop. 21,730 (Republican) East Carroll, LA: Pop. 7,759 (Democrat) Sumter, AL: Pop. 13,763 (Democrat) Lee, KY: Pop. 7,887 (Republican) Allendale, SC: Pop. 10,419 (Democrat) Humphreys, MI: Pop. 9,375 (Democrat) Wolfe, KY: Pop. 7,355 (Republican) Randolph, GA: Pop. 7,719 (Democrat) Knox, KY: Pop. 31,883 (Republican) Claiborne, MI: Pop. 9,604 (Democrat) Quitman, MI: Pop. 8,223 (Democrat) Hancock, GA: Pop. 9,429 (Democrat) Zavala, TX: Pop. 11,677 (Democrat) List of 20 Poorest Counties by Income Per Capita Wheeler, GA: Pop. 7,421 (Republican) Union, FL: Pop. 15,535 (Republican) Issaquena, MS: Pop. 1,416 (Democratic) Telfair, GA: Pop. 16,500 (Republican) Bledsoe, TN: Pop. 12,876 (Republican) Ziebach, SD: Pop. 2,801 (Mixed, narrowly voted for Trump, voted decisively for Obama and Kerry) Stewart, GA: Pop. 6,058 (Democrat) Elliot, KY: Pop. 7,852 (Mixed, voted Trump, voted Democrat every prior election) Concho, TX: Pop. 4,087 (Republican) Glades, FL: Pop. 12,884 (Republican) Long, GA: Pop. 14,464 (Republican) Lafayette, FL: Pop. 8,870 (Republican) McCreary, KY: Pop. 18,306 (Republican) Dooly, GA: Pop. 14,918 (Mixed, voted narrowly for Trump, voted Democrat prior 10 times) San Juan, UT: Pop. 14,746 (Republican) Oglala Lakota, SD: Pop. 13,586 (Democrat) Madison, ID: Pop. 37,536 (Republican) Johnson, GA: Pop. 9,980 (Republican) DeSoto, FL: Pop. 34,862 (Republican) Echols, GA: Pop. 4,034 (Republican) Analyzing the Data Far from this meme’s claim of 95% Republican, the poorest counties in the US breakdown as follows: By Median Household Income: 35% Republican, 60% Democrat and 5% Mixed By Income Per Capita: 70% Republican, 15% Democrat and 15% Mixed This means that both Republicans and Democrats can both claim the poorest counties in the US support the other party depending on the statistics they use! Let’s take a closer look at the poorest counties. Virtually all are in sparsely populated rural areas. Most have less than 20,000 people in the entire county, and many have less than 10,000. To put this in perspective, Los Angeles County has over 10 million people. There are over 250 counties in the US that have populations larger than the top 20 poorest counties combined! This means when someone refers to the “poorest counties in the US”, they are talking about a very small population. Additionally, most of the poorest counties are found in just a few southern states. Particularly Kentucky, Mississippi, Alabama, Georgia and Florida. Looking closer, these counties are heavily concentrated in historically poor areas like Appalachia (home of the white hillbilly culture who tend to vote Republican) and the Mississippi Delta (majority black who tend to vote Democrat). Linking the poverty of these areas to being affiliated with a certain party or ideology makes little sense. Cultural and economic factors are much more likely to blame. Poorest States Are 8 out of the 10 poorest states Republican? Actually, it’s 9 out of 10. Only New Mexico (ranked 44th) could be considered a blue state. Here’s the bottom 10, ranked by median household income (2016 data). Mississippi ($41,754) West Virginia ($43,385) Arkansas ($44,344) Louisiana ($45,146) Alabama ($46,257) Kentucky ($46,659) New Mexico ($46,748) Tennessee ($48,547) Oklahoma ($49,176) South Carolina ($49,501) So why are the poorest states Republican? As with the poorest counties, these states are mostly located in the South, and are heavily rural. This seems to be the biggest correlation for poor areas in the US, not political party. As we saw above, the majority of the poorest counties voted Democrat, so it would be hard to link being poor with Republican. In fact, many of the poorest areas in these “red states” are Democrat strongholds. Another dent in this meme’s narrative is to look at the Supplemental Poverty Index, which is a better and more sophisticated way of looking at poverty. In the latest data from the Census Bureau, we see that California, a strongly Democratic state, ranks highest in poverty. The states with the highest supplemental poverty rates are: California- 20.4% (Democrat) Florida- 18.8% (Mixed) Louisiana- 18.5% (Republican) Arizona- 17.8% (Republican) Mississippi- 16.9% (Republican) Georgia- 16.1% (Republican) New York- 16.0% (Democrat) New Mexico- 15.7% (Democrat) New Jersey- 15.3% (Democrat) Kentucky- 15.0% (Republican) Based on poverty rates, the tally is essentially equally divided among party. Do Red States Take More Federal Money? Yes, according to this analysis. Looking at the chart shown here we can see the tax distribution by state. 7 of the top 10 tax “takers” are red states (considering Florida is mixed). However, 5 of the 10 states on the bottom (the least “moochers”) are also Republican. Again, the distribution appears to rely more on other factors than political party or ideology. For example, 7 out of 10 “moocher” states are in the South. Most of the top 10 are poor and rural. On the other hand, heavily Republican Nebraska is a “maker”, while deep blue Hawaii is a “taker”. In terms of voting percentage, Wyoming voted most strongly for Republicans last election. They are also on the opposite end from the “moochers”. Clearly, voting Republican or Democrat isn’t a great indicator. Conclusion This meme is mixed on its claims. The poorest counties, using the better method (median household income) are actually majority Democrat, not 95% Republican. While 8 out of the top 10 states aren’t Republican, the meme actually understates its case here. Its assertion that red states receive more federal money is also true. However, as we examine the data, it becomes pretty clear that voting Democrat or Republican is not a good indicator or explanation of why areas remain poor or have high poverty rates. It’s valid to point out the hypocrisy if Republicans pretend like its blue states that are the “moochers”, but there’s little evidence to suggest poverty or “moocher” status is based on political party allegiance in the US. Re: The Poorest States are NOT Run by Republicans
Posted by:
Jennifer
()
Date: July 29, 2018 12:29AM xoxo Edited 1 time(s). Last edit at 07/29/2018 12:29AM by Jennifer. Re: The Poorest States are NOT Run by Republicans
Posted by:
Jennifer
()
Date: July 29, 2018 02:32AM (Another great Conservative/Libertarian source is The Heritage Foundation)
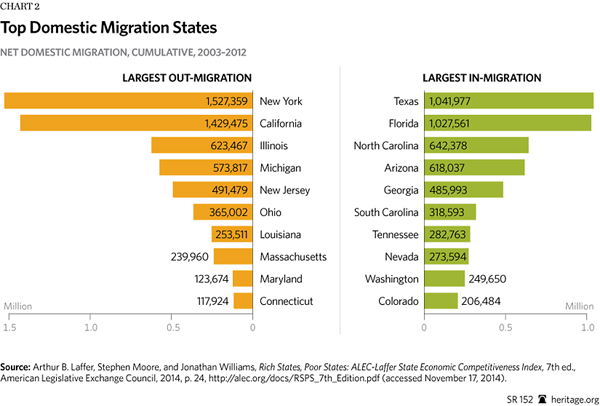
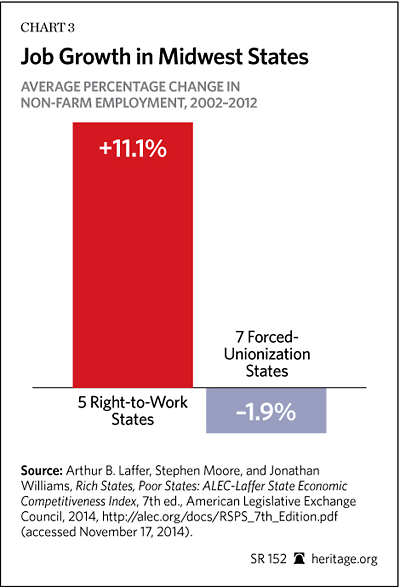
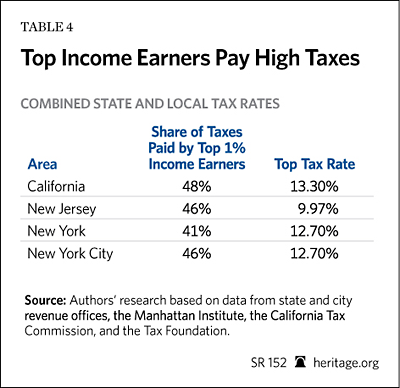
1,000 People a Day: Why Red States Are Getting Richer and Blue States Poorer [www.heritage.org] In recent years, governors have generally divided into two competing camps, which we call the “red state model” and the “blue state model,” raising the stakes in this interstate competition. The conservative red state model is predicated on low tax rates, right-to-work laws, light regulation, and pro-energy development policies. This policy strategy is now common in most of the Southern states and the more rural and mountain states. Meanwhile, the liberal blue state model is predominantly found in the Northeast, California, Illinois, Minnesota, and, until recently, Michigan and Ohio. The blue states have doubled down on policies that include high levels of government spending, high income tax rates on the rich, generous welfare benefits, forced-union requirements, super-minimum-wage laws, and restrictions on oil and gas drilling. 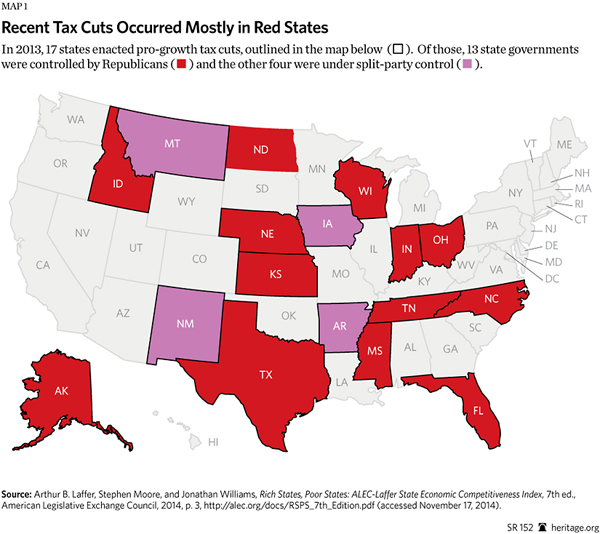
 Edited 2 time(s). Last edit at 07/29/2018 02:56AM by Jennifer. Re: The Poorest States are NOT Run by Republicans
Posted by:
riverhousebill
()
Date: July 29, 2018 05:27AM Now this troll quote the Heritage Foundation as a source of information.
Very Laughable On A Mission! Quoting Heritage Fondation and Amy Mekelburg is spin! - SourceWatch [www.sourcewatch.org] Oct 11, 2017 - Heritage Foundation. Founded in 1973, The Heritage Foundation is a right-wing think tank. Its stated mission is to formulate and promote public policies based on the principles of "free enterprise, limited government, individual freedom, traditional American values, and a strong national defense." Sorry, only registered users may post in this forum.
|
|